Price Graph View
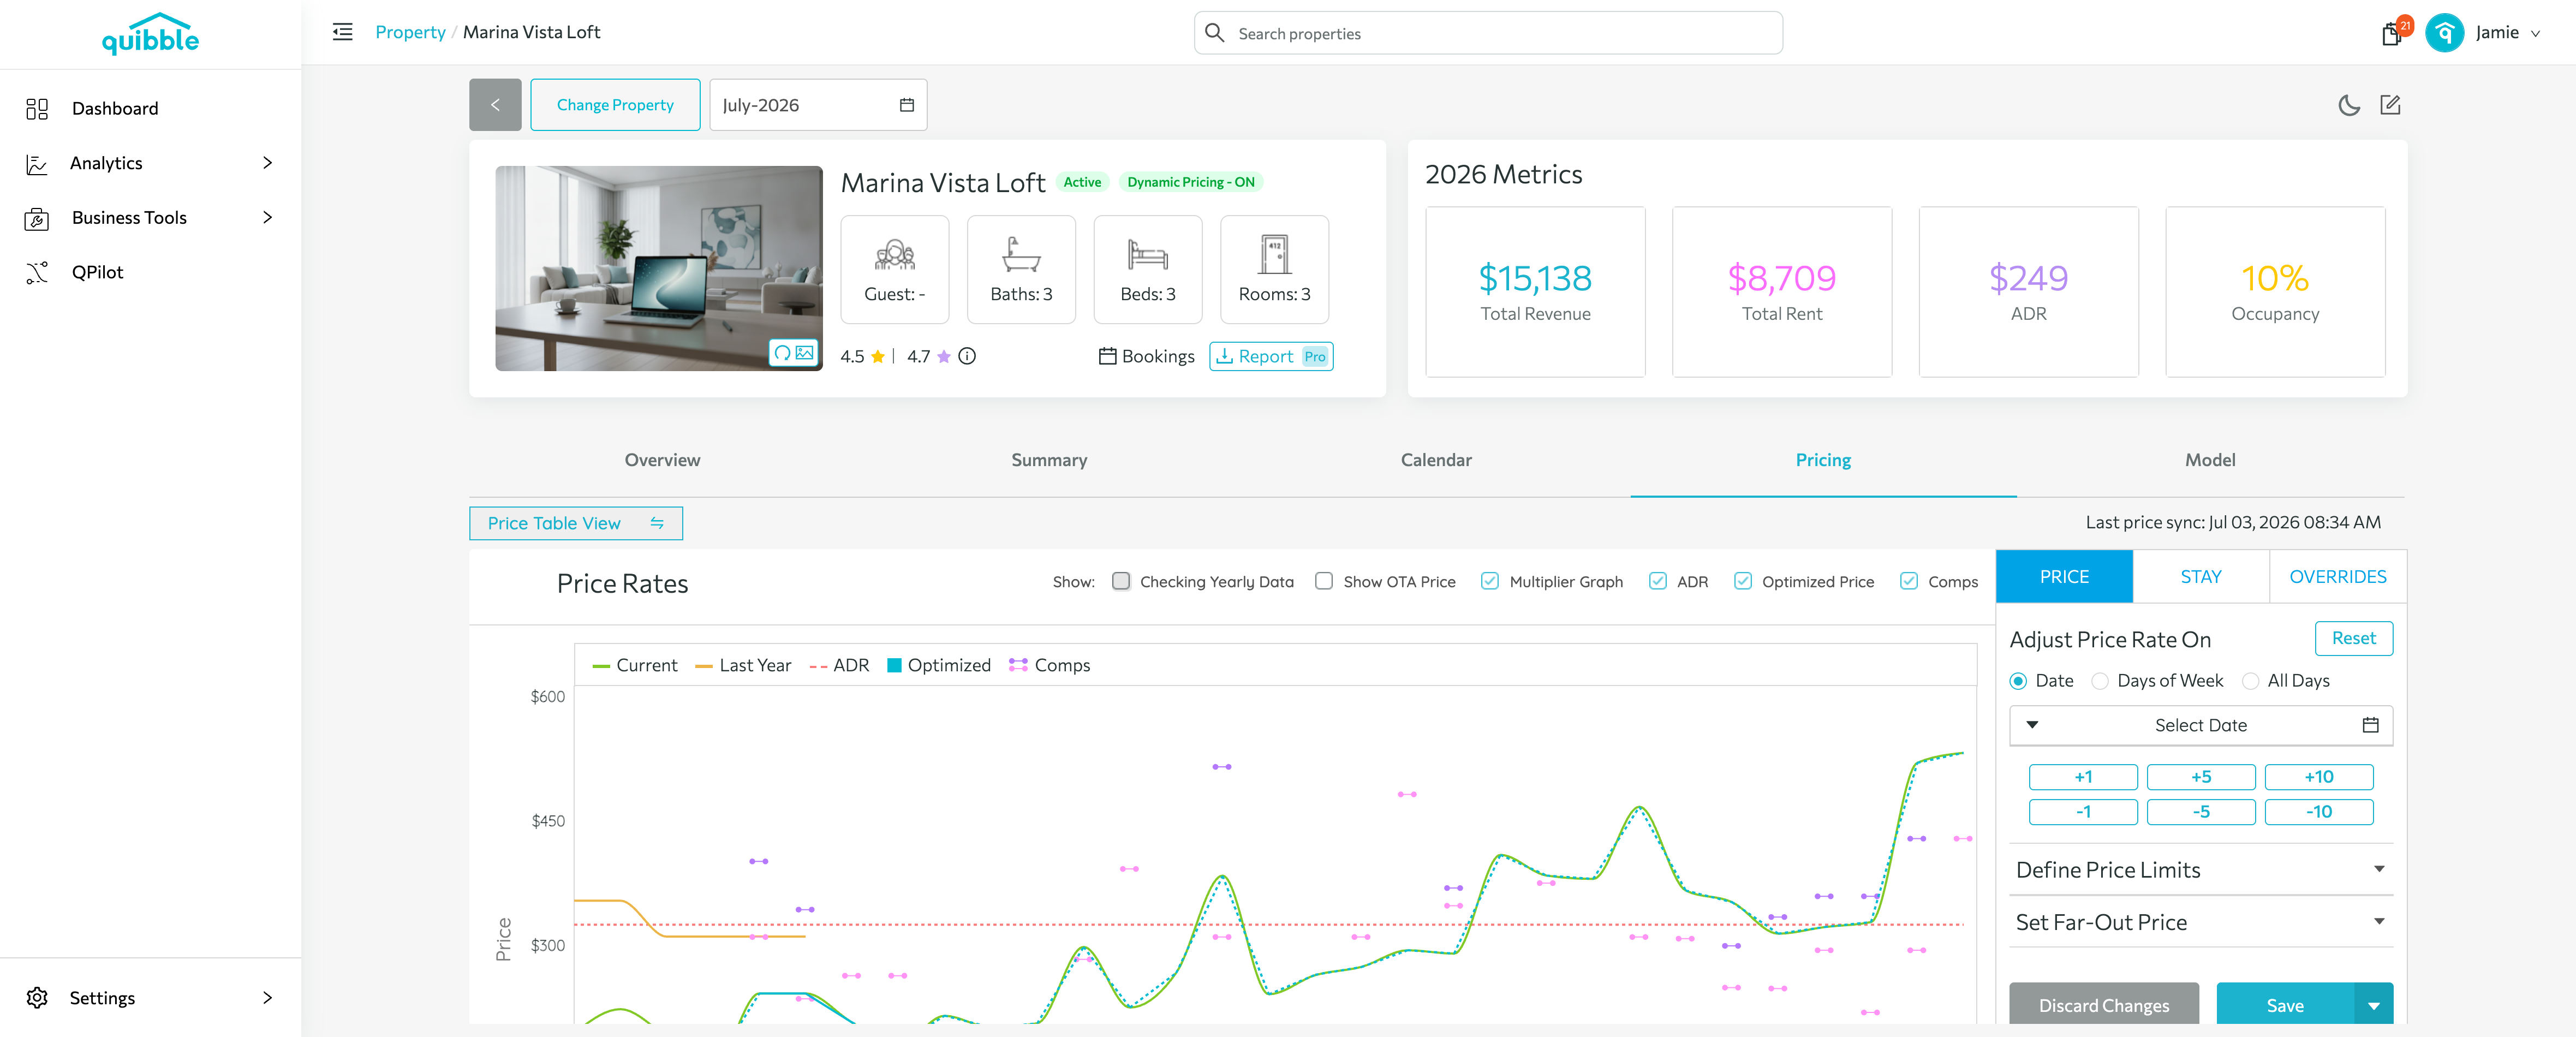
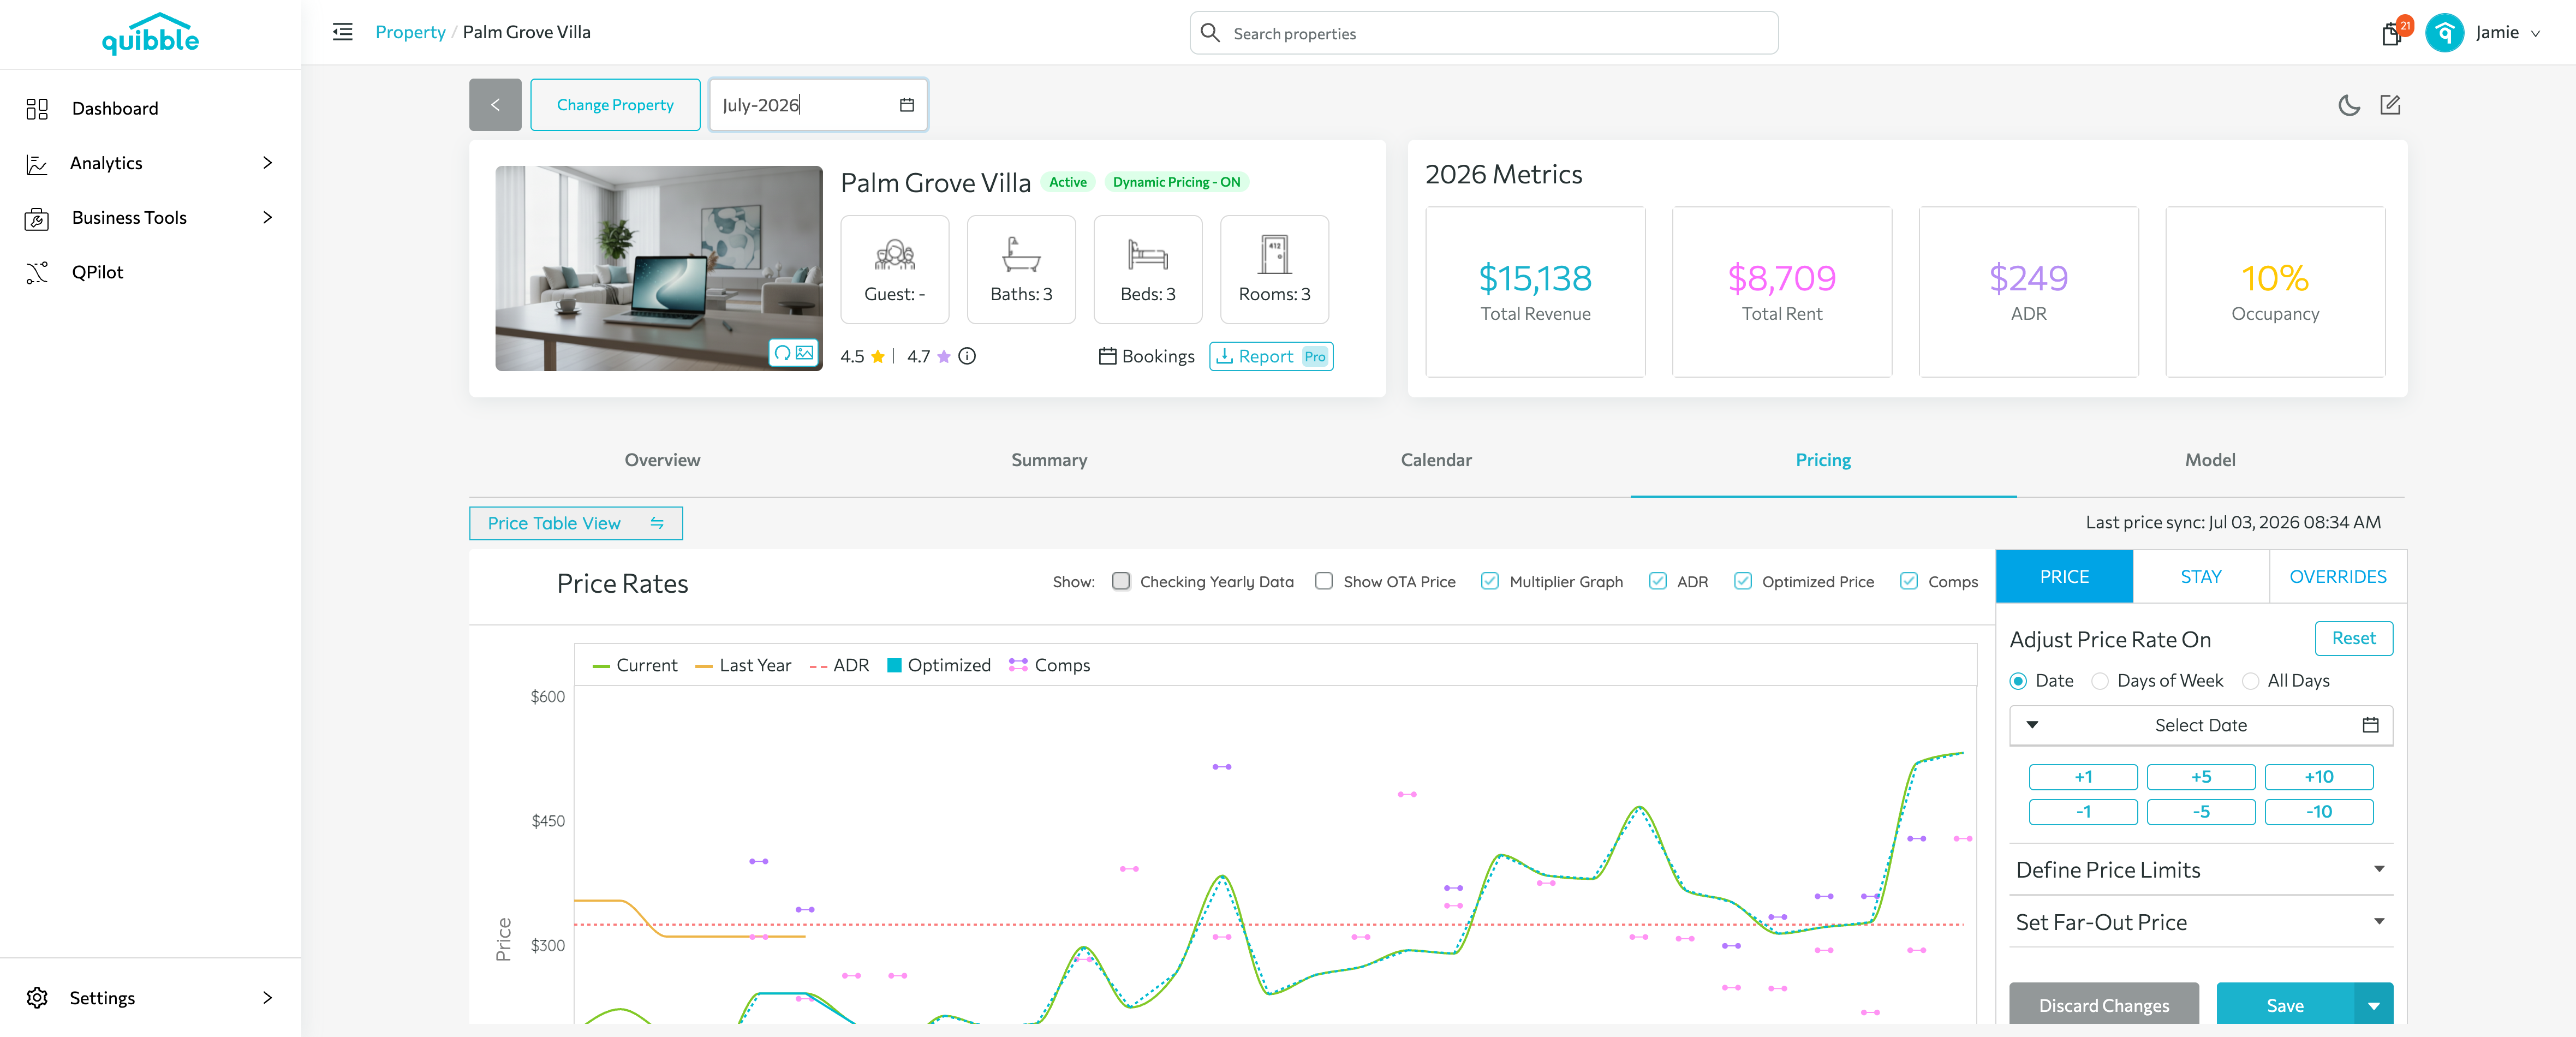
The Price Graph View visualizes a property’s monthly pricing trends so you can make data-driven decisions.
Opening the price graph
1
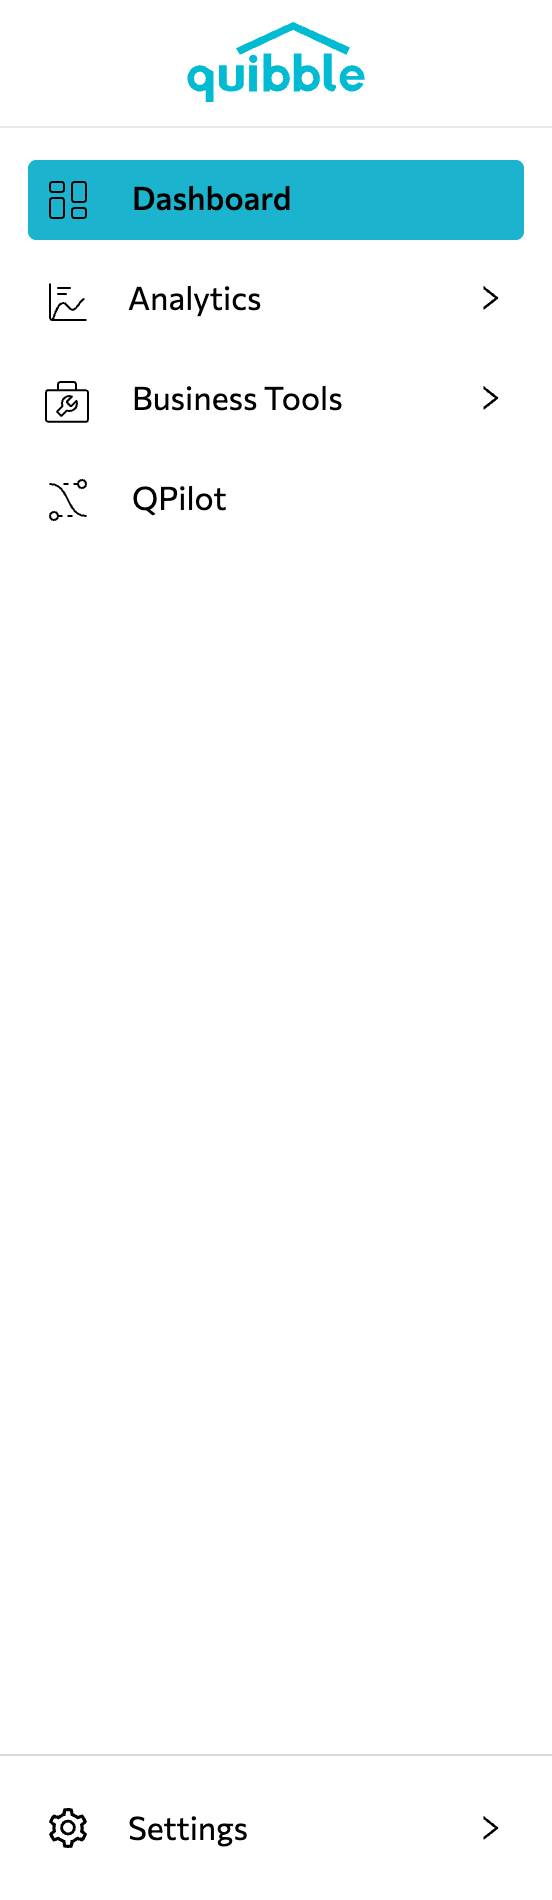
Open the left-side menu bar.
2
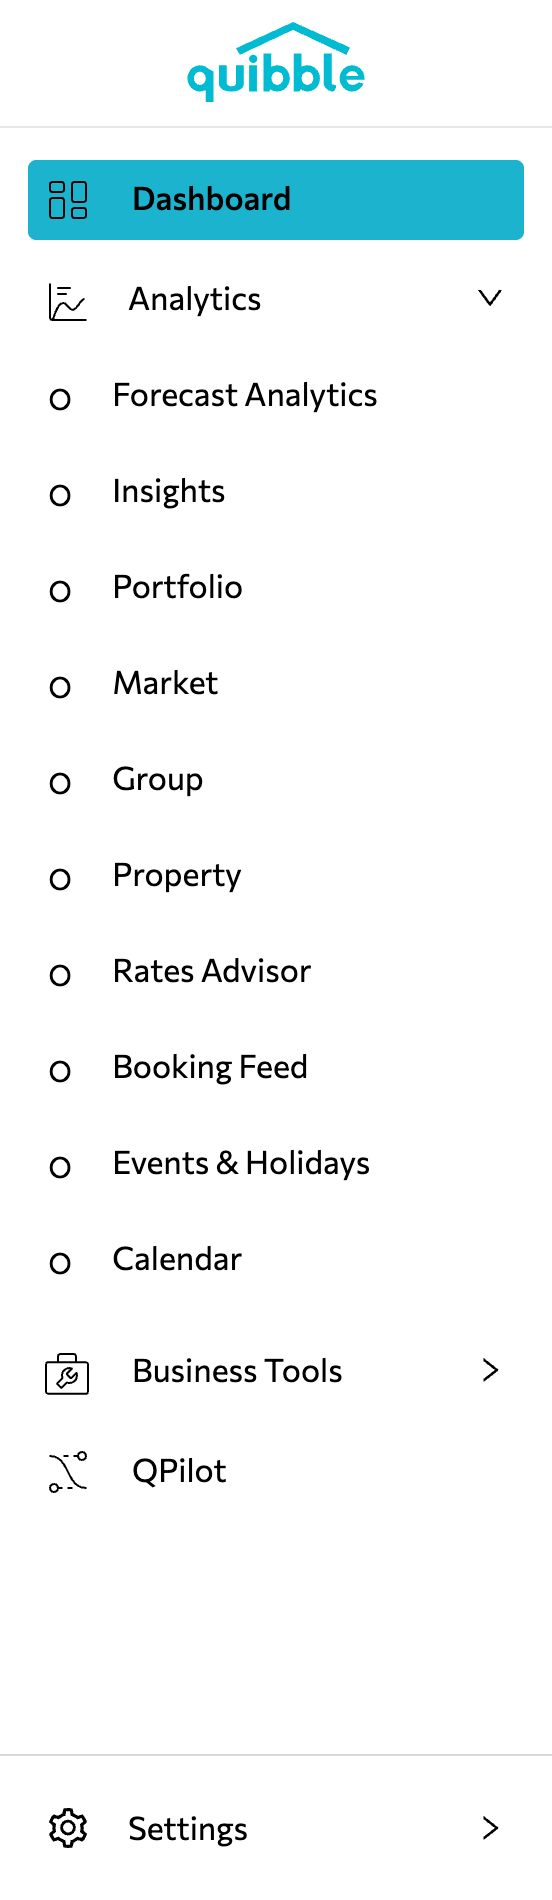
Click the Analytics dropdown and select Property.
3
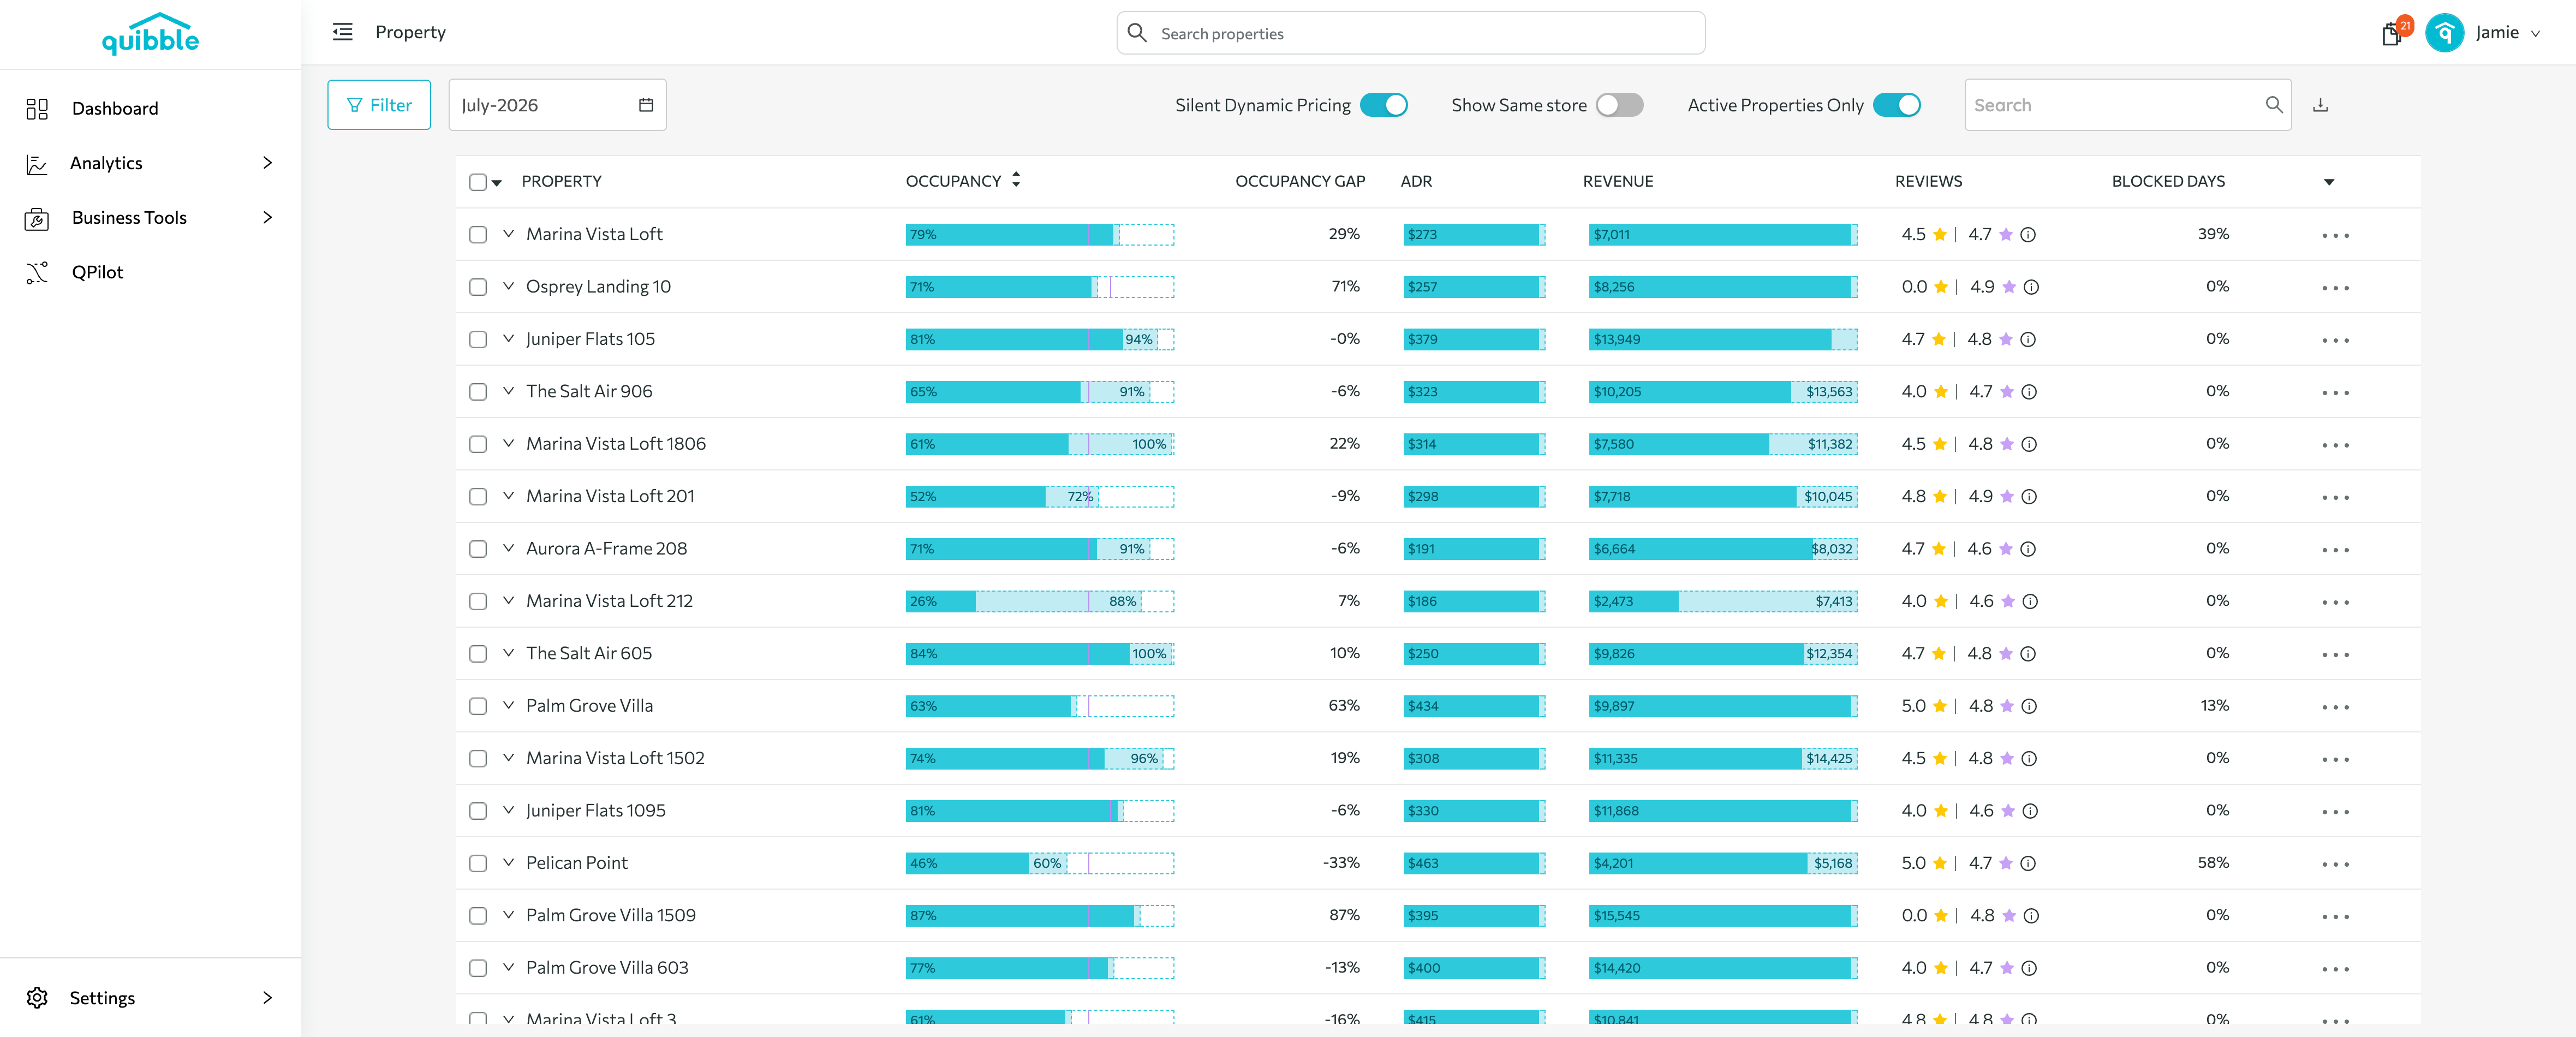
Click the property you want to price.
4
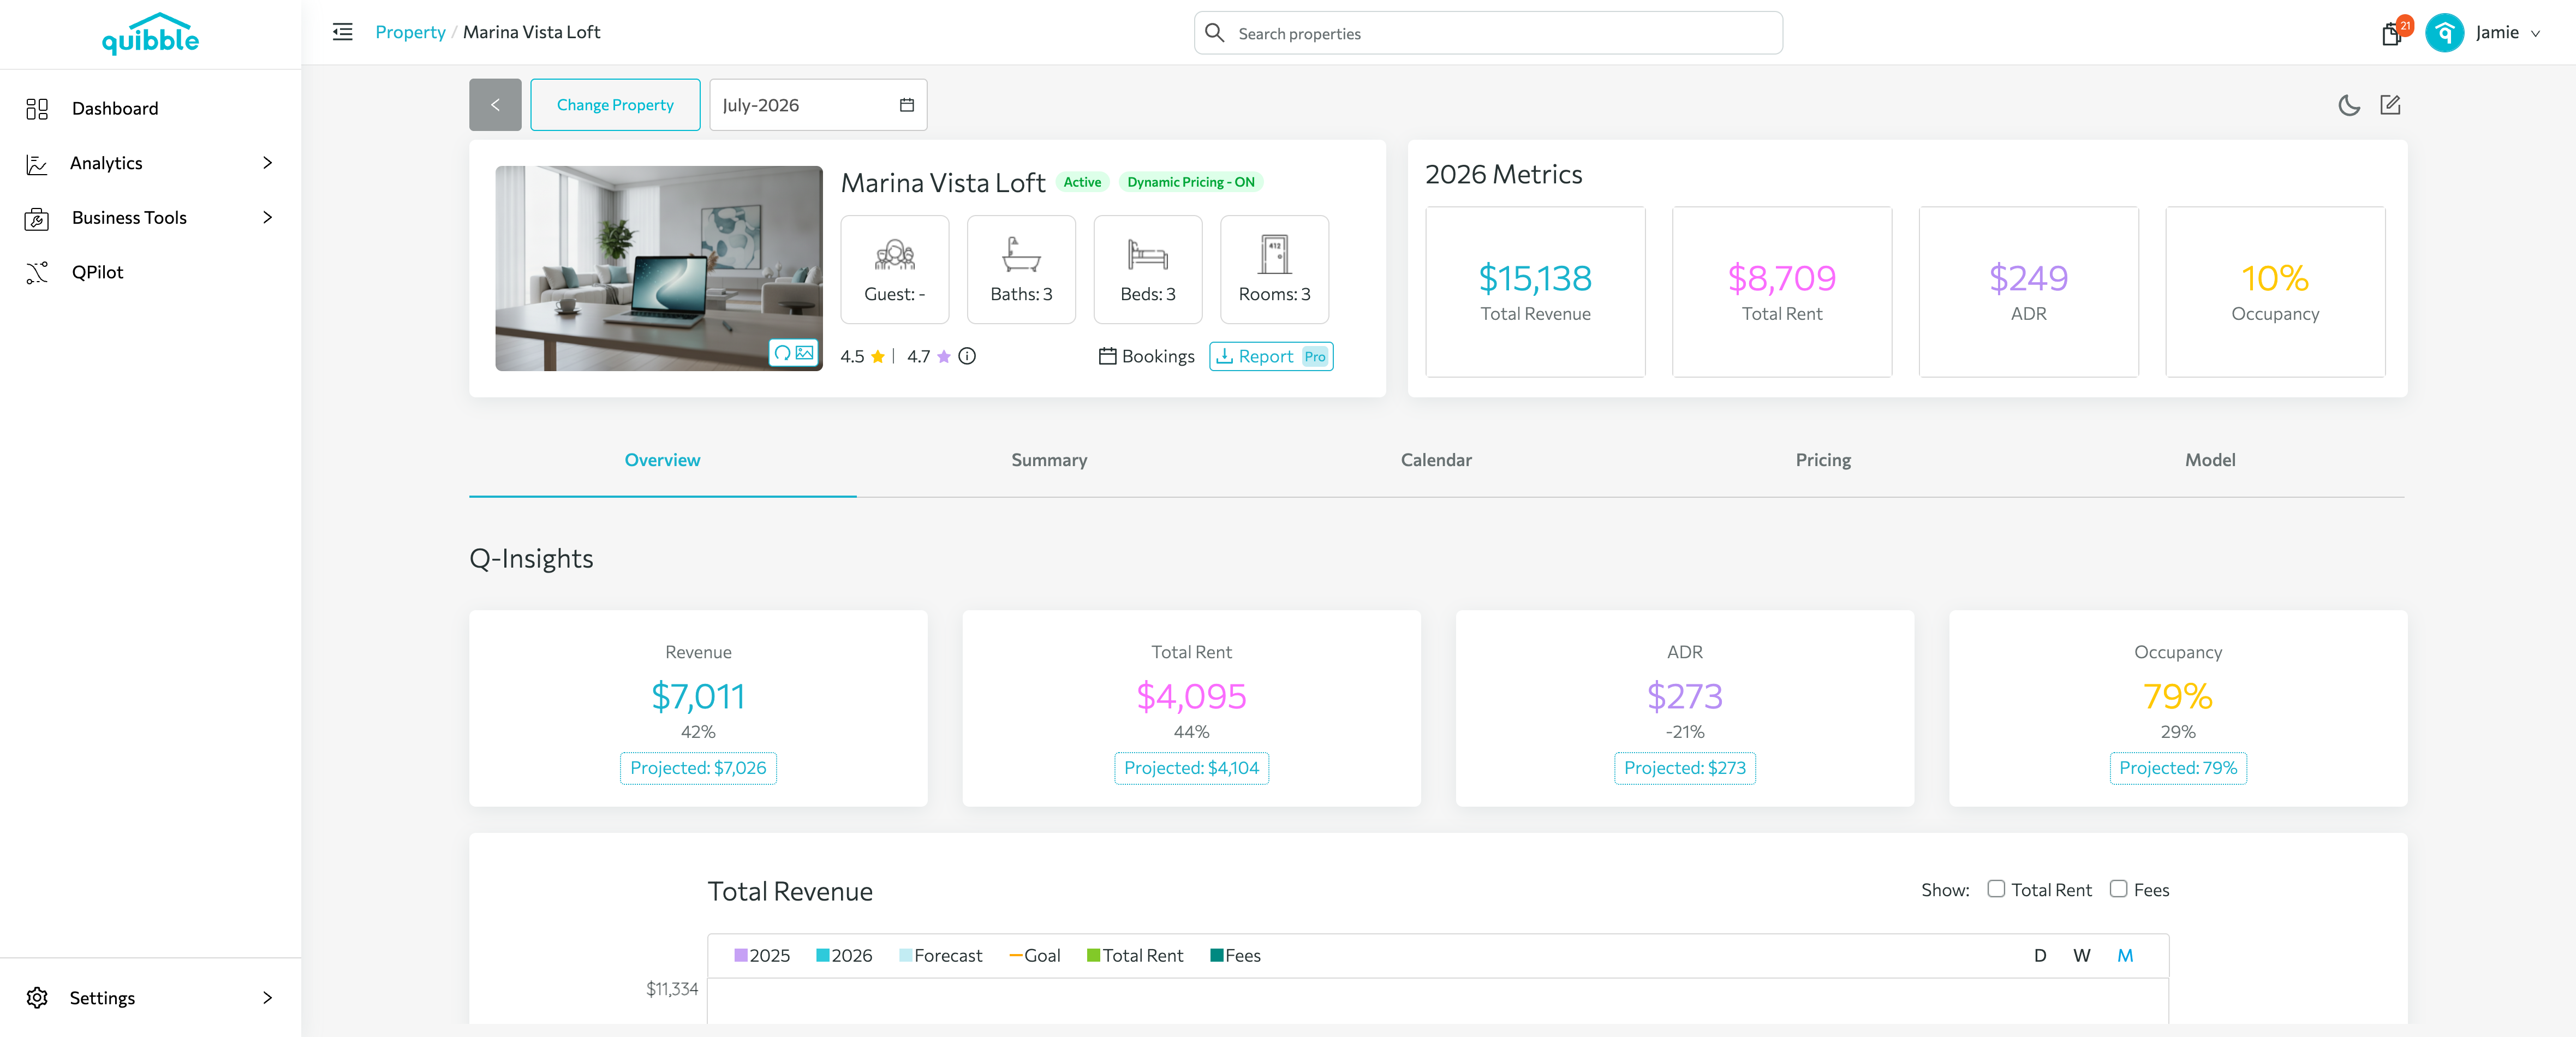
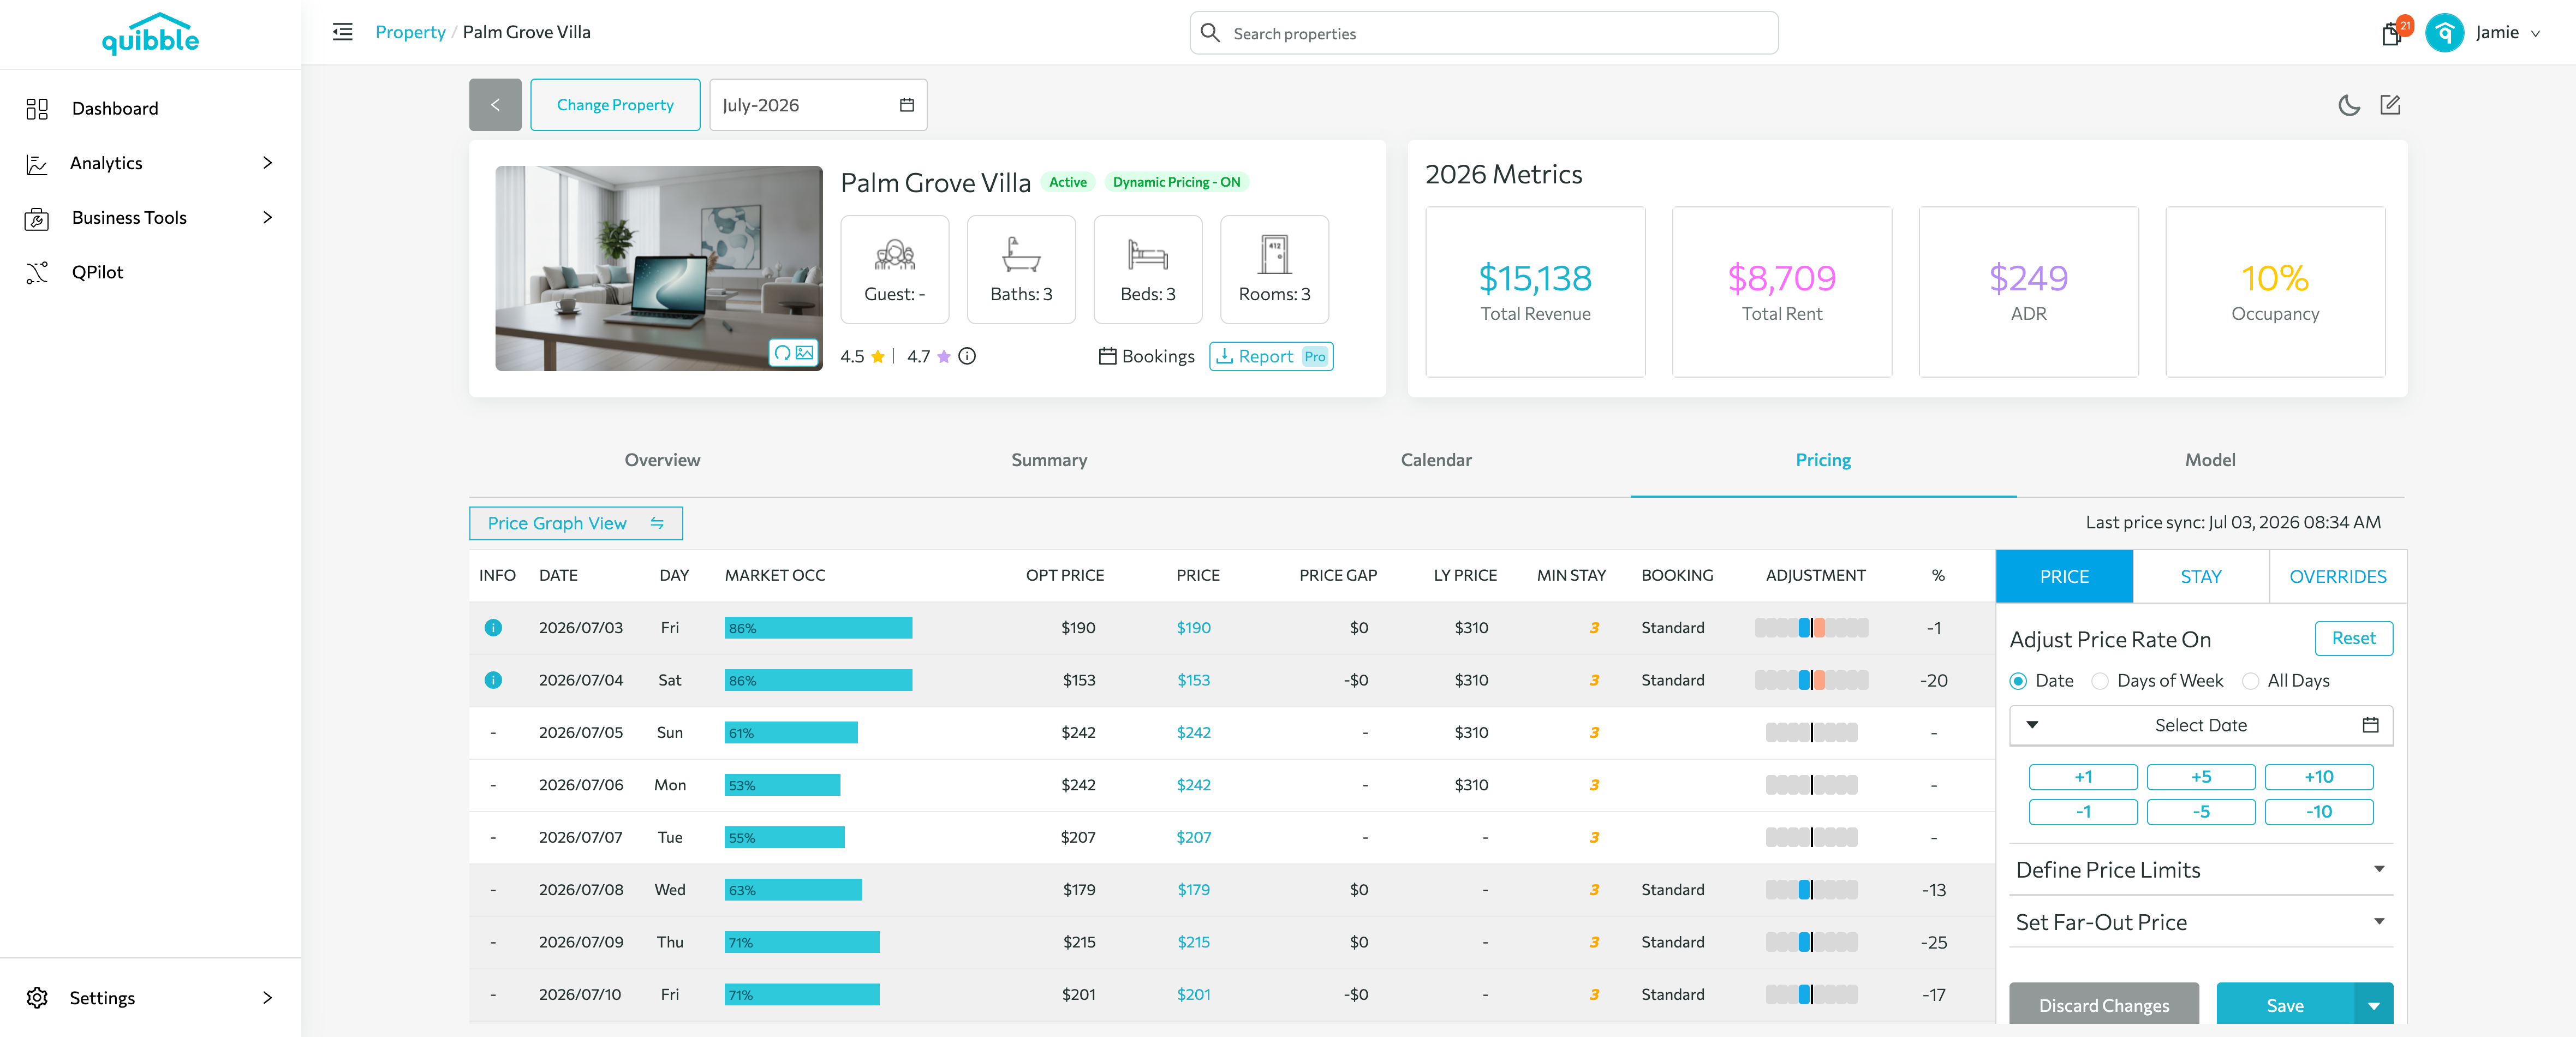
On the property page, open the Pricing tab.
5
Click Price Graph View.
Using the price graph
1
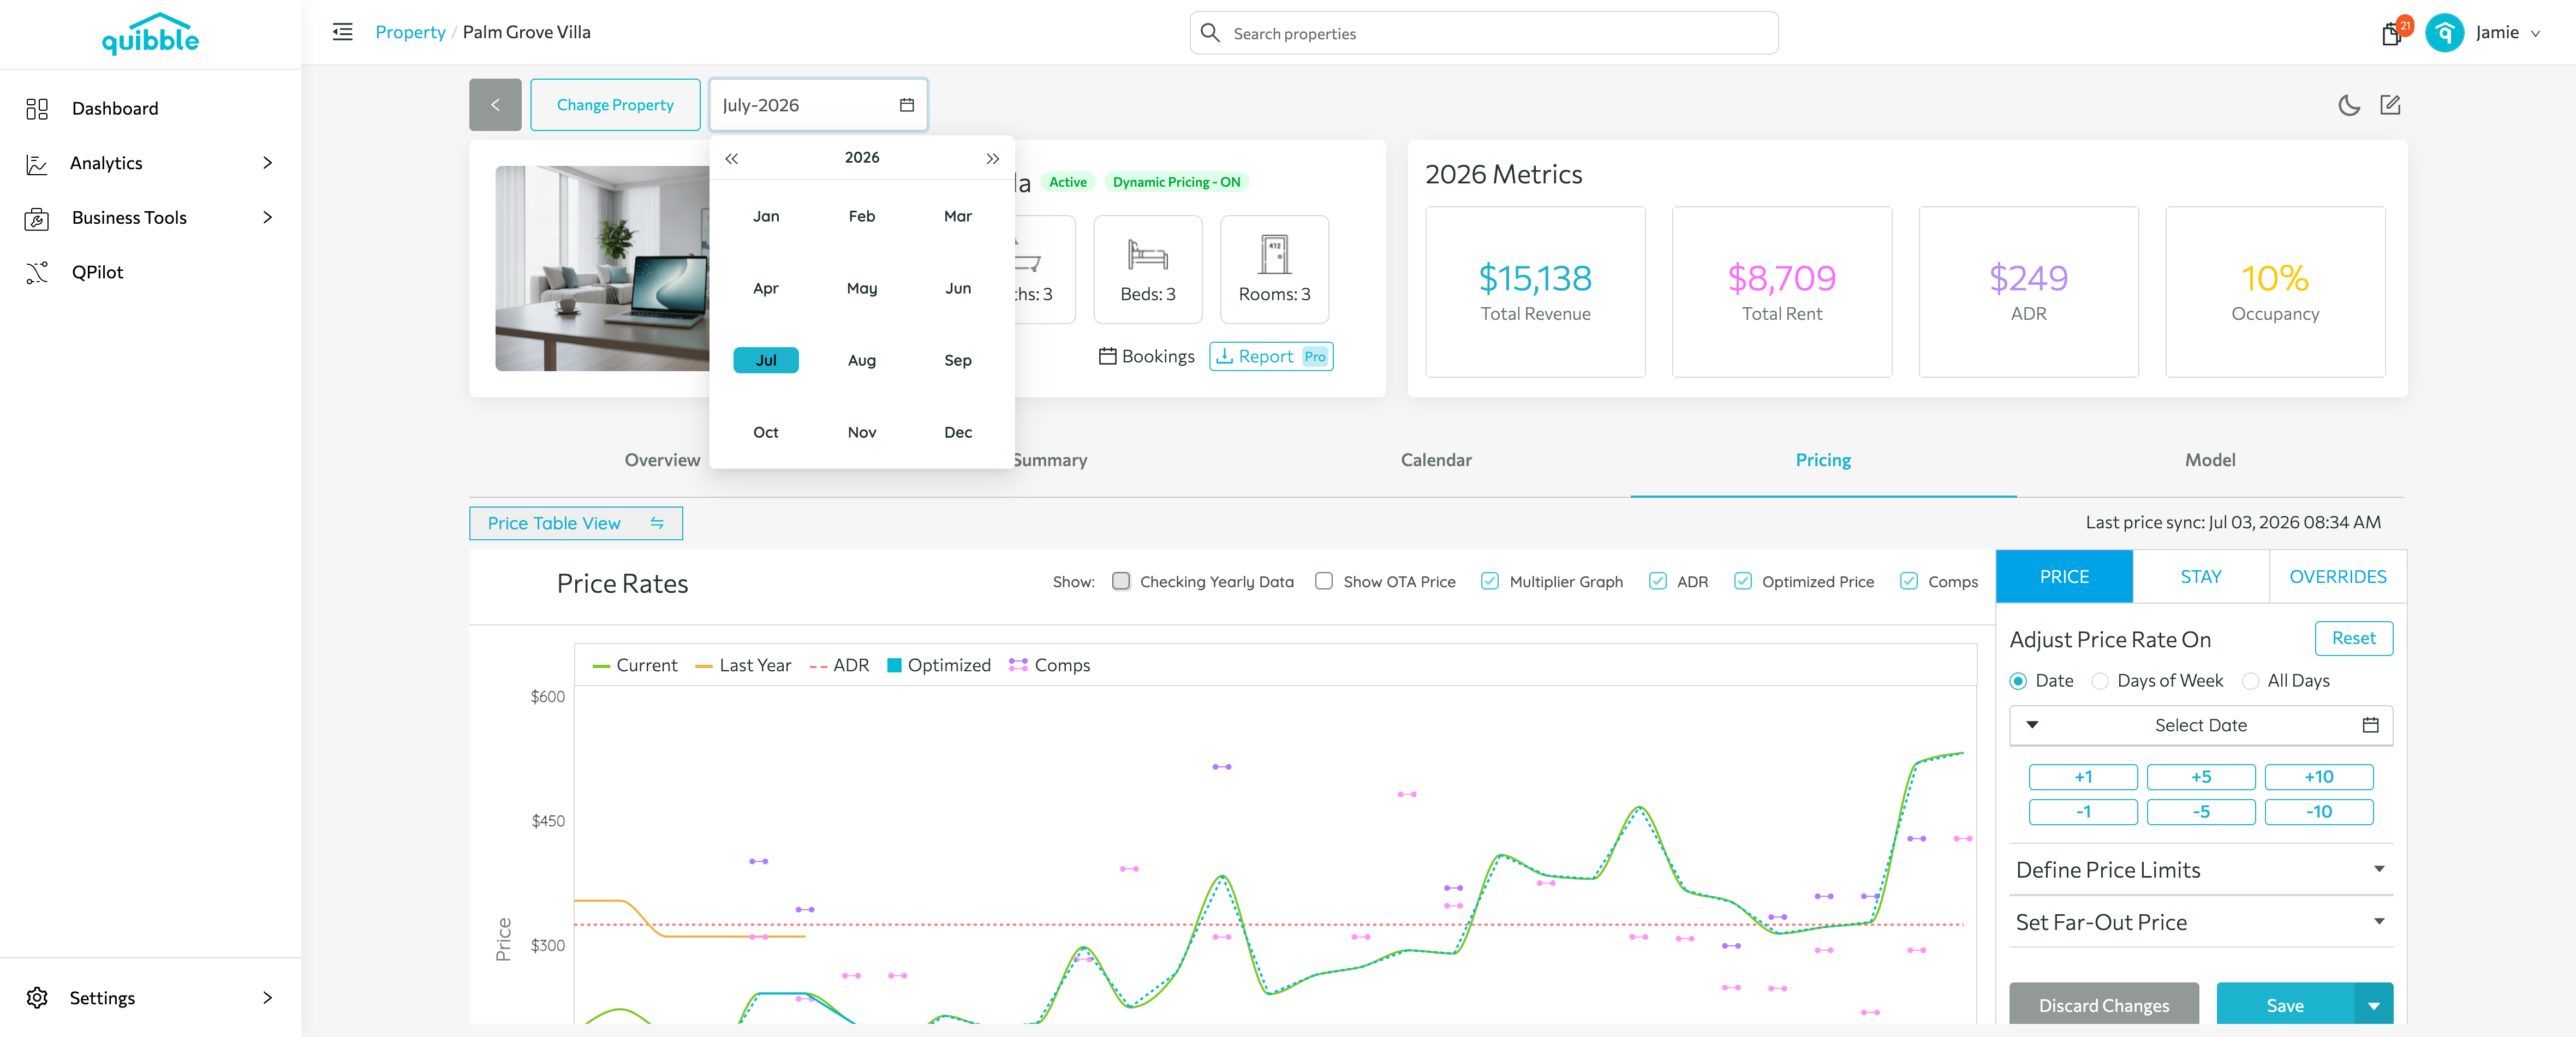
Select the month you want.
2
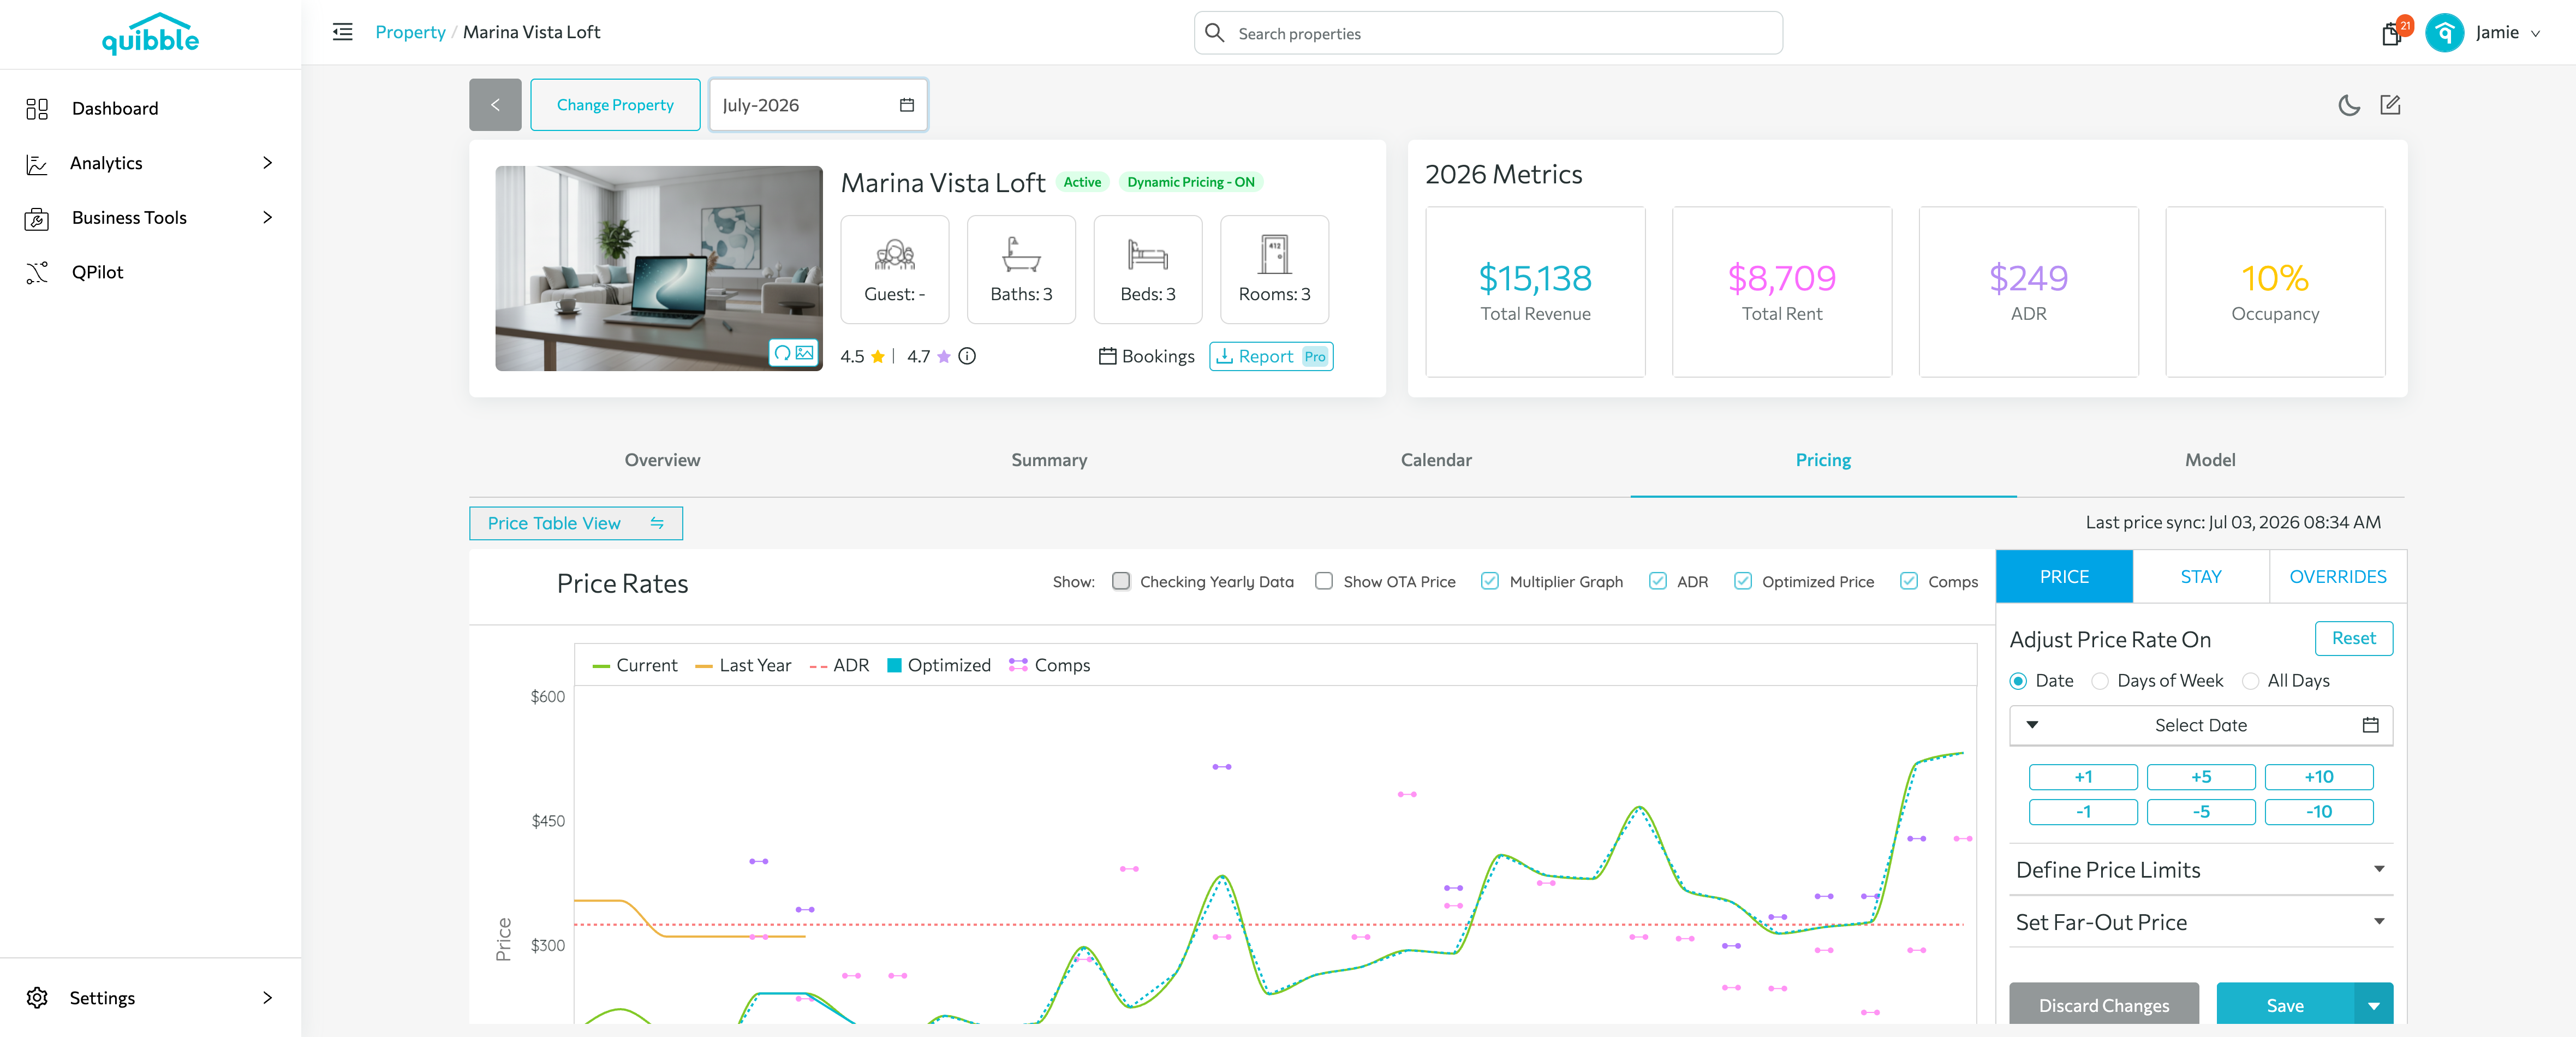
Hover the graph to see the current rate, last year’s rate, ADR, optimized rate, and competitor rates.
3
Set nightly rates by selecting dates from the right menu or the graph.
4
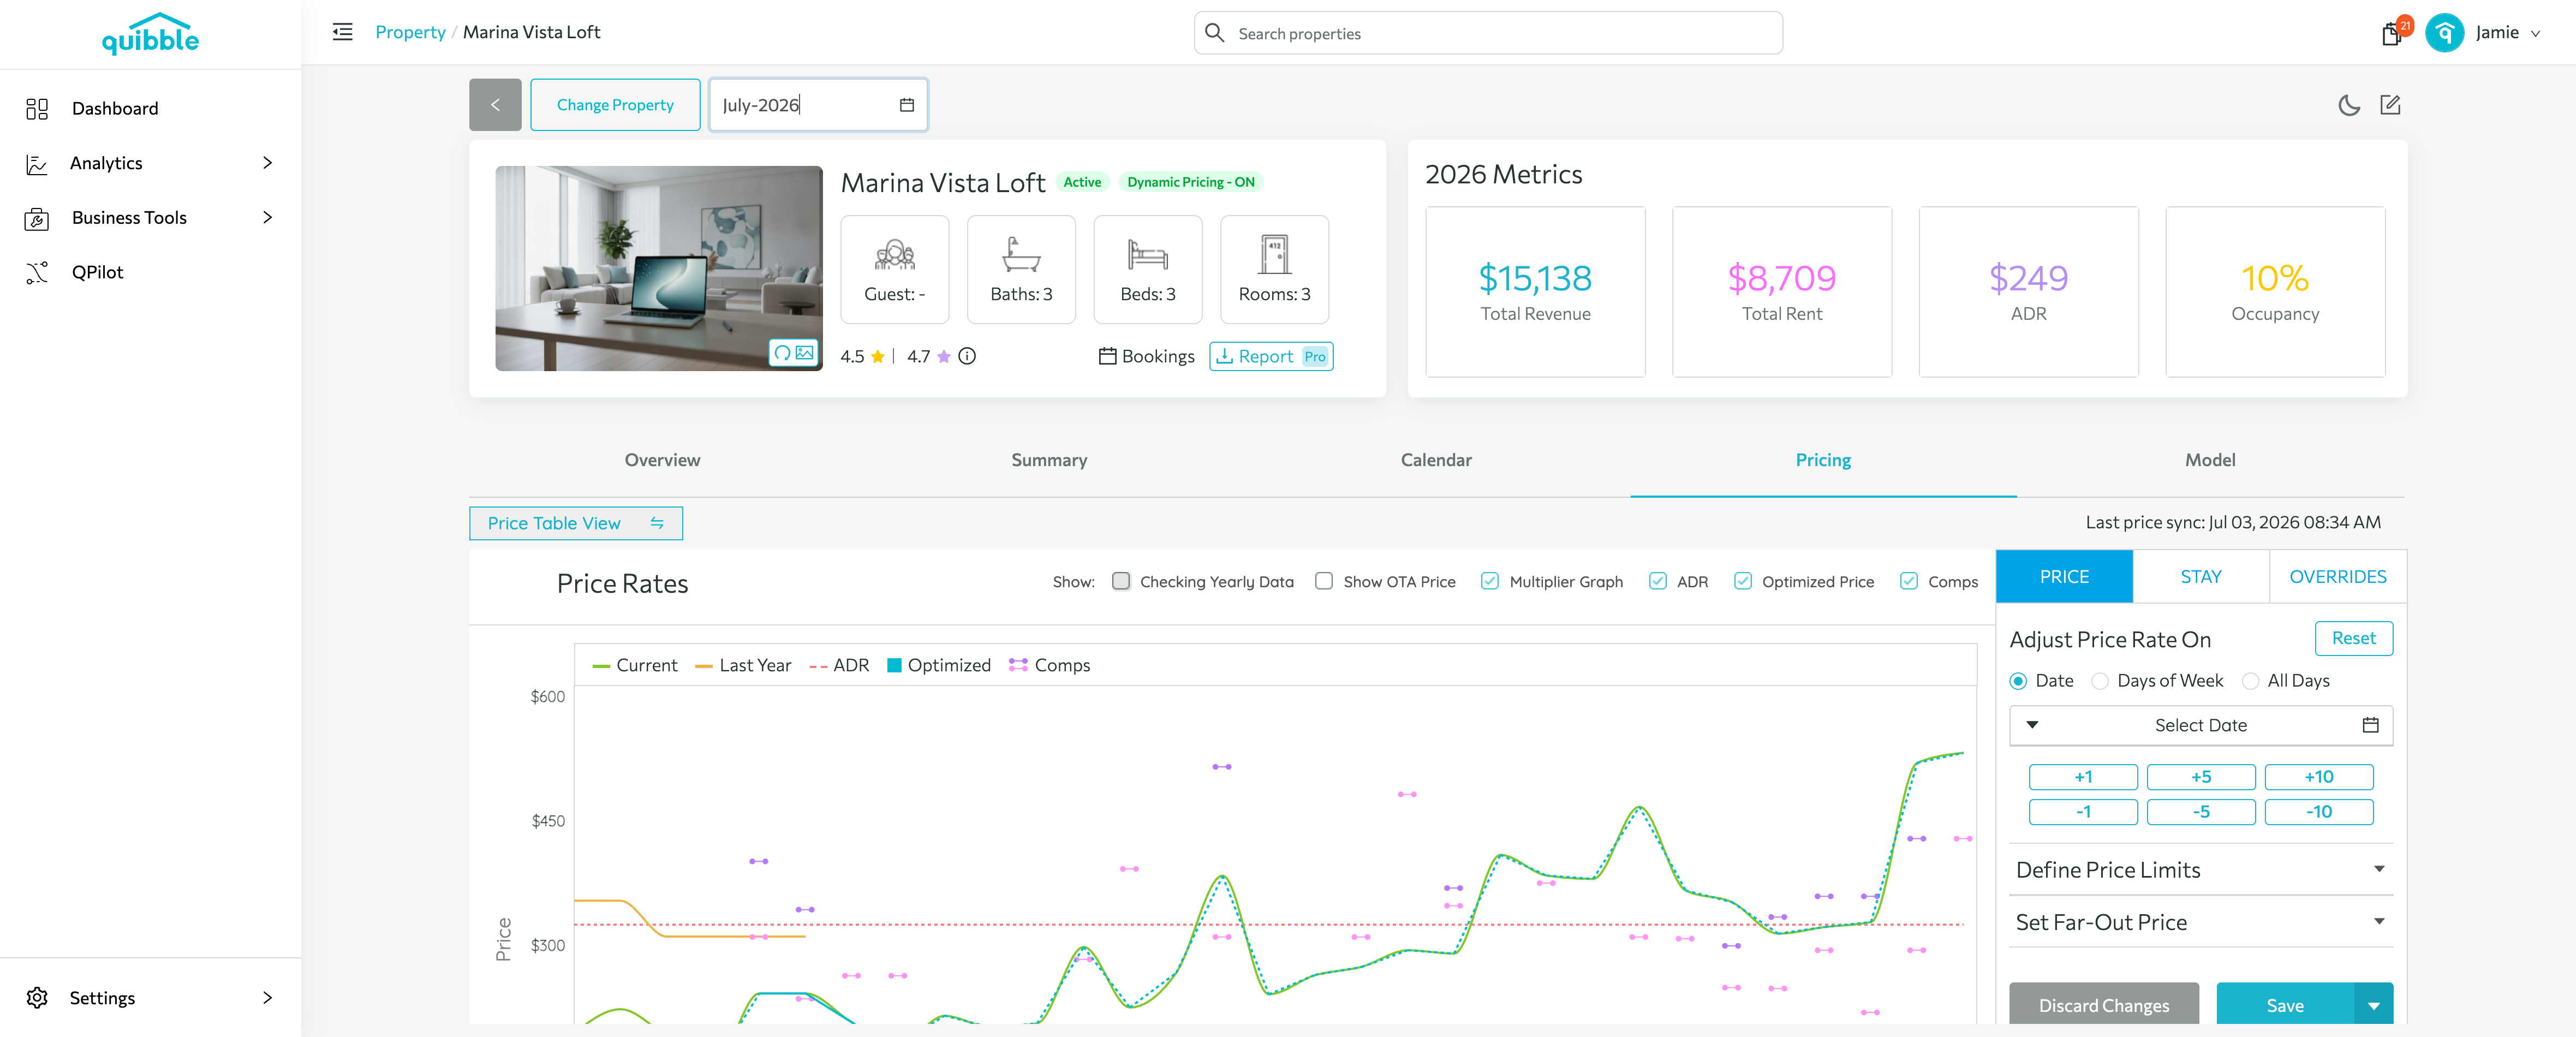
Adjust prices with the Multiplier feature, and set minimum/maximum and far-out pricing.
5
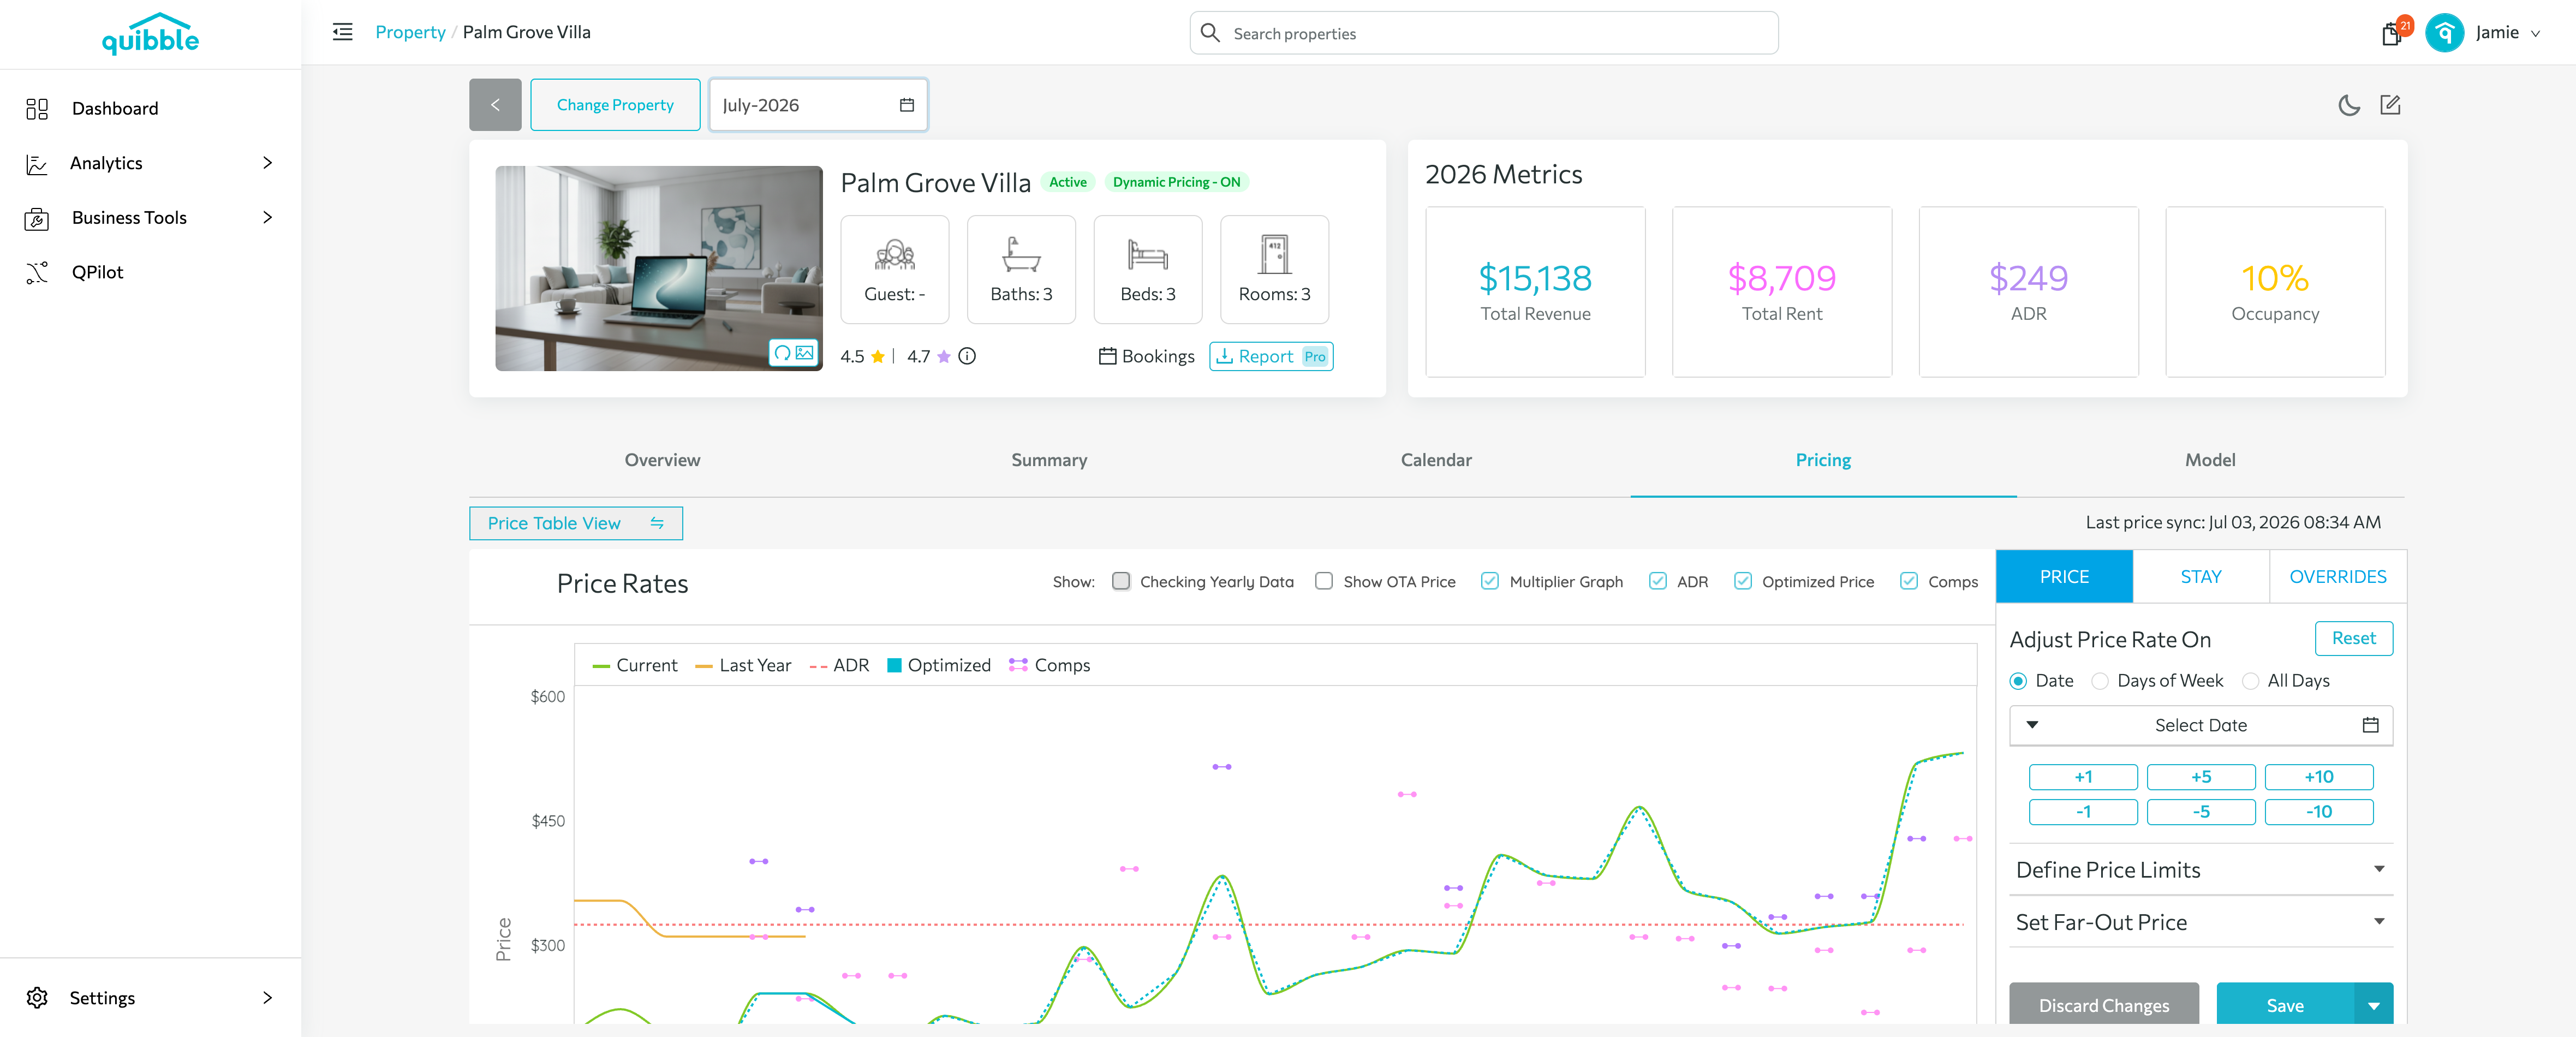
Save with Save or Save and Send.
Didn’t find what you needed? Contact us.